SharePoint console logging can be a nightmare to trawl through with the amount of information and error logging Microsoft leaves in their production code. Locally serving SPFx Extensions for testing on live sites only compounds this. I’ve come across some simple functionality that I had no idea existed whereby you can very easily style console logging.
Big deal, that’s simple ya noob!
Well yeah… I know that (even though I’d never seen it before). For those whom are like I was, here’s the gist:
console.log("Some %cColoured %cOutput", "color: red;", "color: blue;"); // %c is the positional insertion point
Resulting in:

What I want to demonstrate though is how useful it can be for trawling through SPFx console output. This would be easier to demonstrate on an existing Extension project, but fret not if you don’t have one as I’ve got another post detailing how to go about scaffolding a new one, check it out now!
Got an Extension ready to roll? Let’s replicate the output I showed at the top of this post.
Update your onInit method to look like the following:
// ImprovedConsoleLoggingApplicationCustomizer.ts
@override
public onInit(): Promise<void> {
Log.info(LOG_SOURCE, `Initialized ${strings.Title}`);
let message: string = this.properties.testMessage;
if (!message) {
message = '(No properties were provided.)';
}
// Dialog.alert(`Hello from ${strings.Title}:\n\n${message}`);
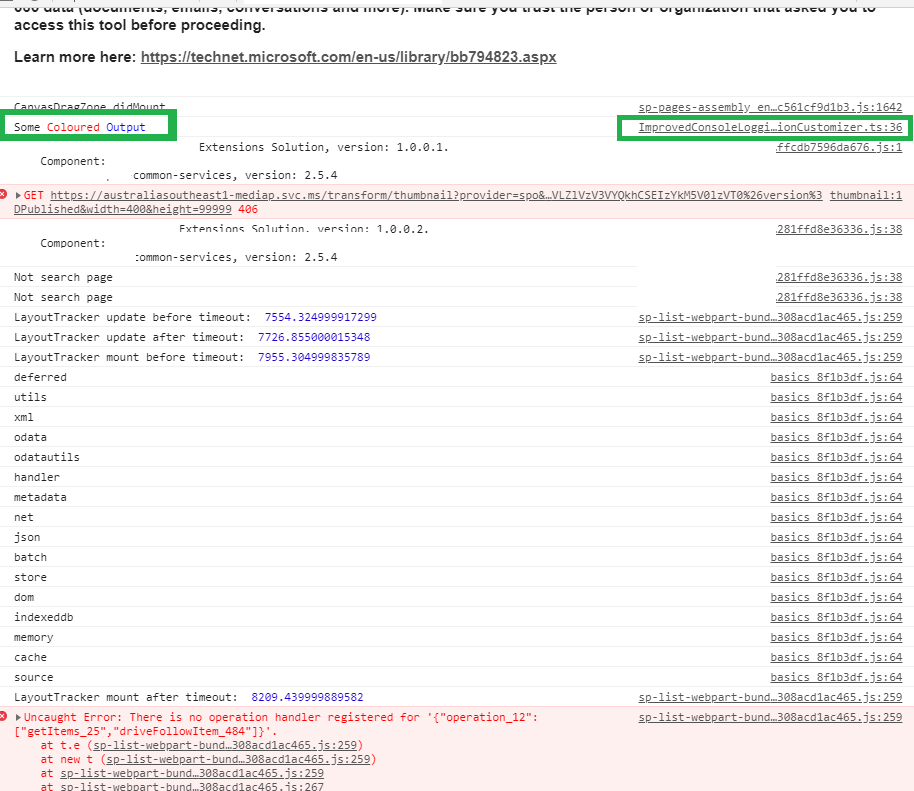
console.log(`Some %cColoured %cOutput`, "color: red;", "color: blue;"); // %c is the positional insertion point
return Promise.resolve();
}
At this point we are still serving the extension locally (run gulp serve --nobrowser again if you aren’t). Simply save the file, wait for the Finished subtask 'reload' notification, refresh your browser window, and view the console output (you’ll see in this screenshot how much of a mess Microsofts’ ootb console logging currently is, and why I believe this approach is necessary).
Improving Console Logging in SPFx
This has all been pretty basic so far. The rest isn’t difficult, but it serves a much more important purpose. Remember how I just mentioned the large amounts of console logging Microsoft put in place?
We’ll simulate some longer running functionality. Let’s add a new method, and update our onInit method as follows:
// ImprovedConsoleLoggingApplicationCustomizer.ts

  @override
  public onInit(): Promise<void> {
    Log.info(LOG_SOURCE, `Initialized ${strings.Title}`);

    const loggingDelay: number = 1500; // milliseconds

    let message: string = this.properties.testMessage;
    if (!message) {
      message = '(No properties were provided.)';
    }

    console.log(`%cAbout to invoke outputDelayedLogging`, "color: blue;");
    this.outputDelayedLogging(`\toutputDelayedLogging invoked after ${loggingDelay} ms`, loggingDelay);

    return Promise.resolve();
  }

  private outputDelayedLogging(message, ms: number): void {
    setTimeout(() => {
      console.log(`%c${message}`, "color: orange;");
    }, ms);
  }
Save and reload your browser, noting the console output again.
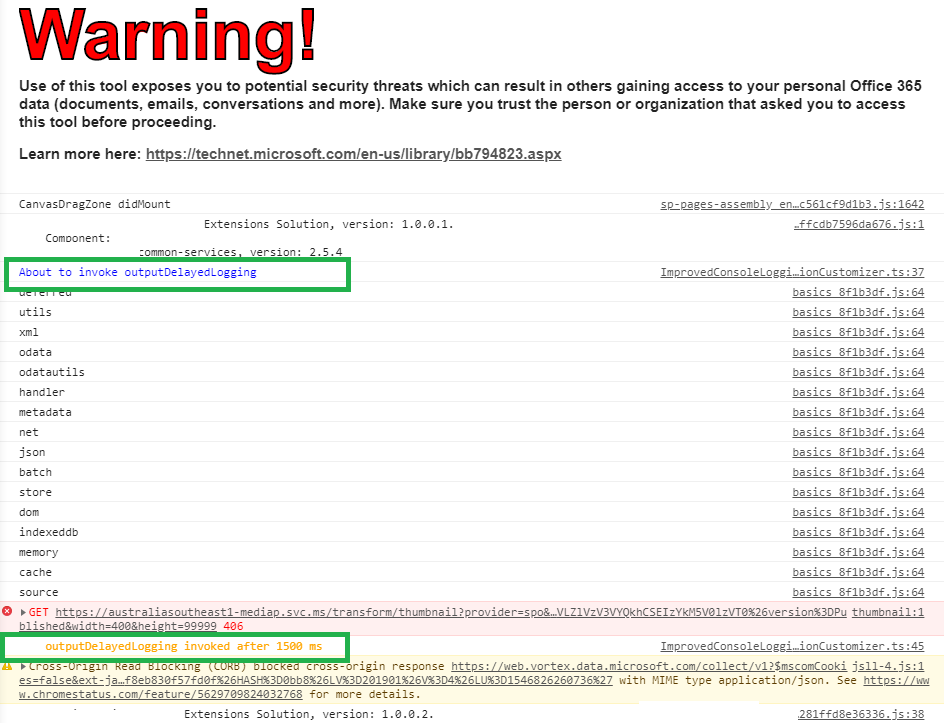
You can clearly see where these two console.log invocations are. Do you see where I am going with this?
Great, we can style console output. Now what?
Where this becomes useful is when we’ve got very long running and complicated processes running across multiple projects and we need to quickly triage issues. Often times console logging spans over hundreds of rows. It’s very hard at a glance to see exactly what’s going on.
Additionally, we may not want to always show our debug logging to the end user, so we’ll render it conditionally.
Let’s update our example again. First, we’ll add a new boolean property doTrace.
export interface IImprovedConsoleLoggingApplicationCustomizerProperties {
  // This is an example; replace with your own property
  testMessage: string;
  doTrace: boolean;
}
doTrace will allow for us to flag that we’re intending to trace various components and elements within our project to assist in triaging of issues.
Next we’ll update our onInit and outputDelayedLogging methods to only conditionally render our output. We’ll add the following:
- new constants debugColourOvr and debugFontWeightOvr.
// ImprovedConsoleLoggingApplicationCustomizer.ts

  @override
  public onInit(): Promise<void> {
    Log.info(LOG_SOURCE, `Initialized ${strings.Title}`);

    const loggingDelay: number = 1500; // milliseconds

    const simulatedLongRunningLogging: string = `\toutputDelayedLogging invoked after ${loggingDelay} ms\r\n\tdebug X: longRunningResult1\r\n\tdebug Y: longRunningResult2\r\n\tdebugZ: longRunningResult3`;

    const debugColourOvr: string = `orange`;
    const debugFontWeightOvr: string = `800`;

    if (this.properties.doTrace) {
      console.log(`%cLoading extension in trace mode\r\n\tAbout to invoke outputDelayedLogging`, `color: ${debugColourOvr};`);

      this.outputDelayedLogging(simulatedLongRunningLogging, loggingDelay, debugFontWeightOvr);
    } else {
      console.log(`Loading extension normally...`);
    }

    return Promise.resolve();
  }

  private outputDelayedLogging(message, ms: number, fontWeightOvr: string = ""): void {
    setTimeout(() => {
      console.log(`%c${message}`, `color: orange;${fontWeightOvr !== "" ? `font-weight: ${fontWeightOvr}` : ""}`);
    }, ms);
  }
Save the file again, then refresh the browser. Note that console output is now simply showing the following (we’re not in doTrace mode, in fact we’ve not provided a value for that property at all):

Back to the URL in your browser, update the properties as follows:
// from
"properties":{"testMessage":"Hello%20World"}

// to
"properties":{"testMessage":"Hello%20World","doTrace":true}
Reload the browser again, and now take note of how easy it is to pick out the console logging for this particular component:
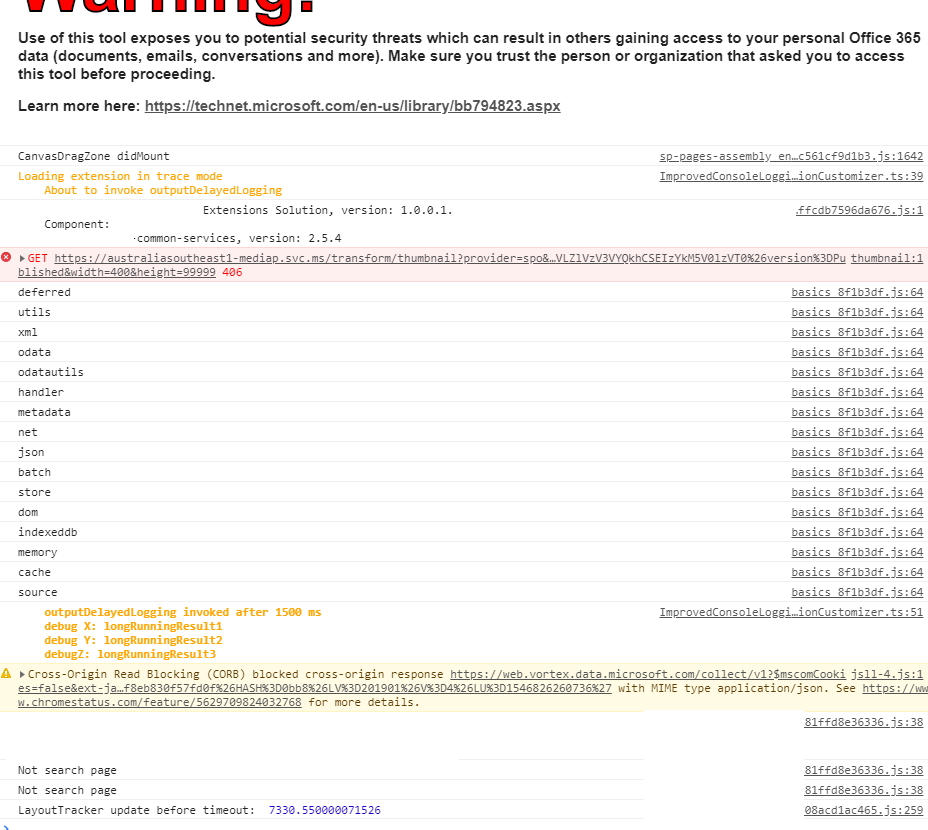
Useful? I think so…
What have we learned here?
- We can style console logging.
- We can conditionally style that logging in SPFx.
- We can render logging from other projects that may have long running processes by way of using SPFx Extension properties within the manifest.
- The logging rendered in this way will be easy to validate for initial triage purposes.
Imagine for a moment that these two very basic console outputs were across multiple SPFx projects, and that you needed to be able to easily validate a few key details for initial triage, such as identifying various version numbers, API query strings, end-points etc, all highlighted in a common colour allowing you to pick out exactly what’s going on.
Microsoft should do this in my opinion as their console output really isn’t pleasant to trawl through, but that’s for another conversation :)
Until next time…