In my previous post we discussed how we could go about styling browser dev tool console logging to assist with the initial triage of issues within our SPFx Extensions.
I was working on the project that spawned that post again today, and didn’t like the way I’d handled the conditional nature of the styled console output.
So, what are we going to talk about today?
The approach I illustrated is fine for a Web Part project because we can easily tie it to the property pane. Indeed, I’ve integrated those changes into those projects already. I’ve realised that it isn’t very dev or end-user friendly from the context of simplifying those all important initial triage stages of an Extension problem.
Why’s that you ask?
- The methodology I’ve used relies upon being able to update the manifest of the Extension so that we can see debug output.
- This doesn’t bode well for quick triage due to having to load up the project in Visual Studio Code and debugging using
gulp serve, while using an updated manifest in the query string. This can cause other issues when that Extension already exists - we end up with two instances of it (an old and the currently loaded - let’s not talk about what happens to styling of deployed extensions when you’re serving locally). - What I want to achieve is to not have to do any local debugging until we have triaged a few things first.
- This is also not useful if you needed to ask the client to get you some quick triage information if they’re having issues in an environment you don’t have acces to.
We’re doing this to improve our service to our clients right? They don’t care about your technical instructions, that their explanation makes no sense or that you need to run debugging locally to find an obscure issue - it’s much easier for them if you can simply say “press F12, paste in this URL, press enter… now tell me what all of the orange text says”.
Not good enough then… what are we going to do about it?
The idea here is that we will use the presence of a token within document.location.href in conjunction with our pre-existing support for the presence of a boolean property within the Extension manifest. That combination will flag whether we’re tracing or not, and handle the console styling as before.
Below is the ImprovedConsoleLoggingApplicationCustomizer class from the previous post, including our minor changes (indicated by the NEW and UPDATED comments). You’ll see by the end that this really improves that all important initial triage process.
// ImprovedConsoleLoggingApplicationCustomizer.ts

export default class ImprovedConsoleLoggingApplicationCustomizer
  extends BaseApplicationCustomizer<IImprovedConsoleLoggingApplicationCustomizerProperties> {

  /*
    start NEW

      We will support the presence of the following:
      - this.properties.doTrace boolean from the manifest.
      - trace token in the URL of the page (you can call it whatever you want).
   */
  private doTrace: boolean = this.properties.doTrace || (document.location.href.indexOf(`?trace`) > -1 || document.location.href.indexOf(`&trace`) > -1);
  // end NEW

  @override
  public onInit(): Promise<void> {
    Log.info(LOG_SOURCE, `Initialized ${strings.Title}`);

    const loggingDelay: number = 1500; // milliseconds

    const simulatedLongRunningLogging: string = `\toutputDelayedLogging invoked after ${loggingDelay} ms\r\n\tdebug X: longRunningResult1\r\n\tdebug Y: longRunningResult2\r\n\tdebugZ: longRunningResult3`;

    const debugColourOvr: string = `orange`;
    const debugFontWeightOvr: string = `800`;

    if (this.doTrace) { // UPDATED was this.properties.doTrace
      console.log(`%cLoading extension in trace mode\r\n\tAbout to invoke outputDelayedLogging`, `color: ${debugColourOvr};`);

      this.outputDelayedLogging(simulatedLongRunningLogging, loggingDelay, debugFontWeightOvr);
    } else {
      console.log(`Loading extension normally...`);
    }

    return Promise.resolve();
  }

  private outputDelayedLogging(message, ms: number, fontWeightOvr: string = ""): void {
    setTimeout(() => {
      console.log(`%c${message}`, `color: orange;${fontWeightOvr !== "" ? `font-weight: ${fontWeightOvr}` : ""}`);
    }, ms);
  }
}
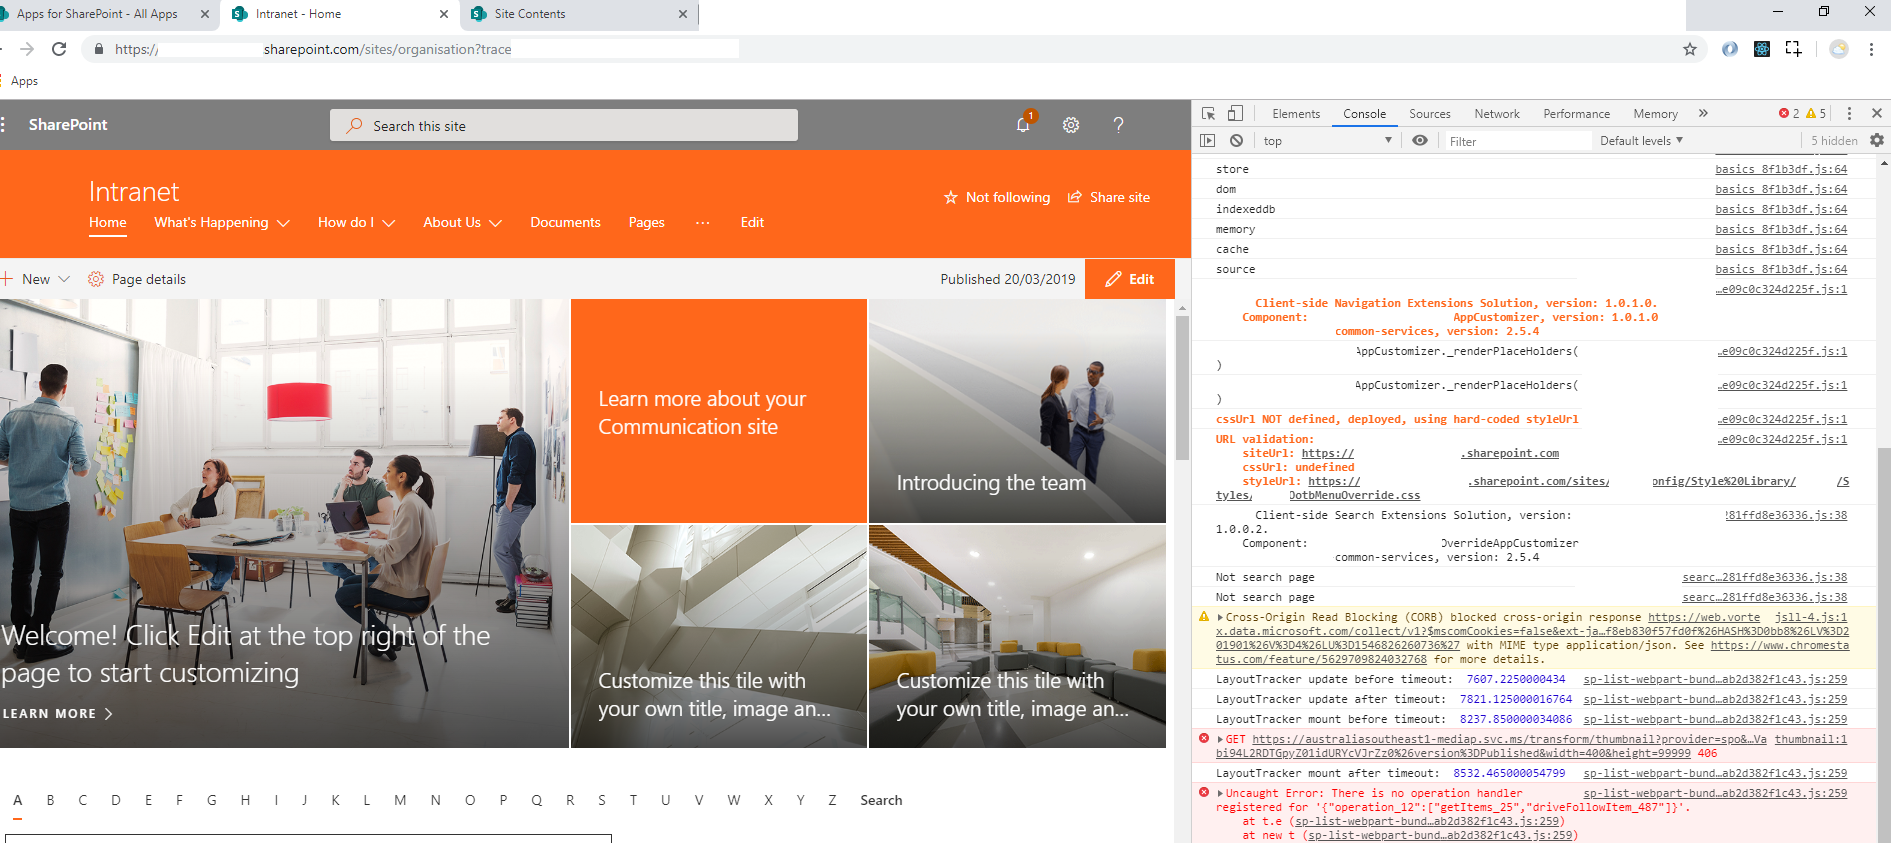
Now all we need to do to trace an Extension on a client environment is add either ?trace or &trace to the end of the URL in the address bar (note the presence of ? and &). At that point the console logging will be styled as it was before.
This updated functionality means that we can ask a customer to do that for us and simply send us an extract or screenshot of the logging.
Here’s what it looks like on one of our live test tenants, note the page URL:
I’ve begun to implement this across the entirety of our SPFx Extensions projects/solutions. I’m using differing trace... tokens in each project so that I can toggle each Extension into trace mode quickly and in isolation of each other by making them more verbose. I am also applying different colours to each so that they can be picked out when they’re not isolated.
Toggling two different Extensions into trace mode together is now trivial using the page URL, e.g: https://[tenantName].sharepoint.com/sites/[siteName]?traceImprovedConsoleLoggingApplicationCustomizer&traceMenuStylingOverrideApplicationCustomizer.
Clean. Efficient. Extensible… just the way I like it!
Let me know your thoughts. Until next time.